Hi, I'm Yan.
I specialize in helping companies and researchers analyze and visualize their datasets. I excel in data visualization. If you're looking for guidance on presenting your results or building complex interactive charts, I'm the expert you're seeking.
With a solid 12-year track record in data science, I've collaborated with prestigious research institutes like the University of Queensland and leading private companies such as Datadog.
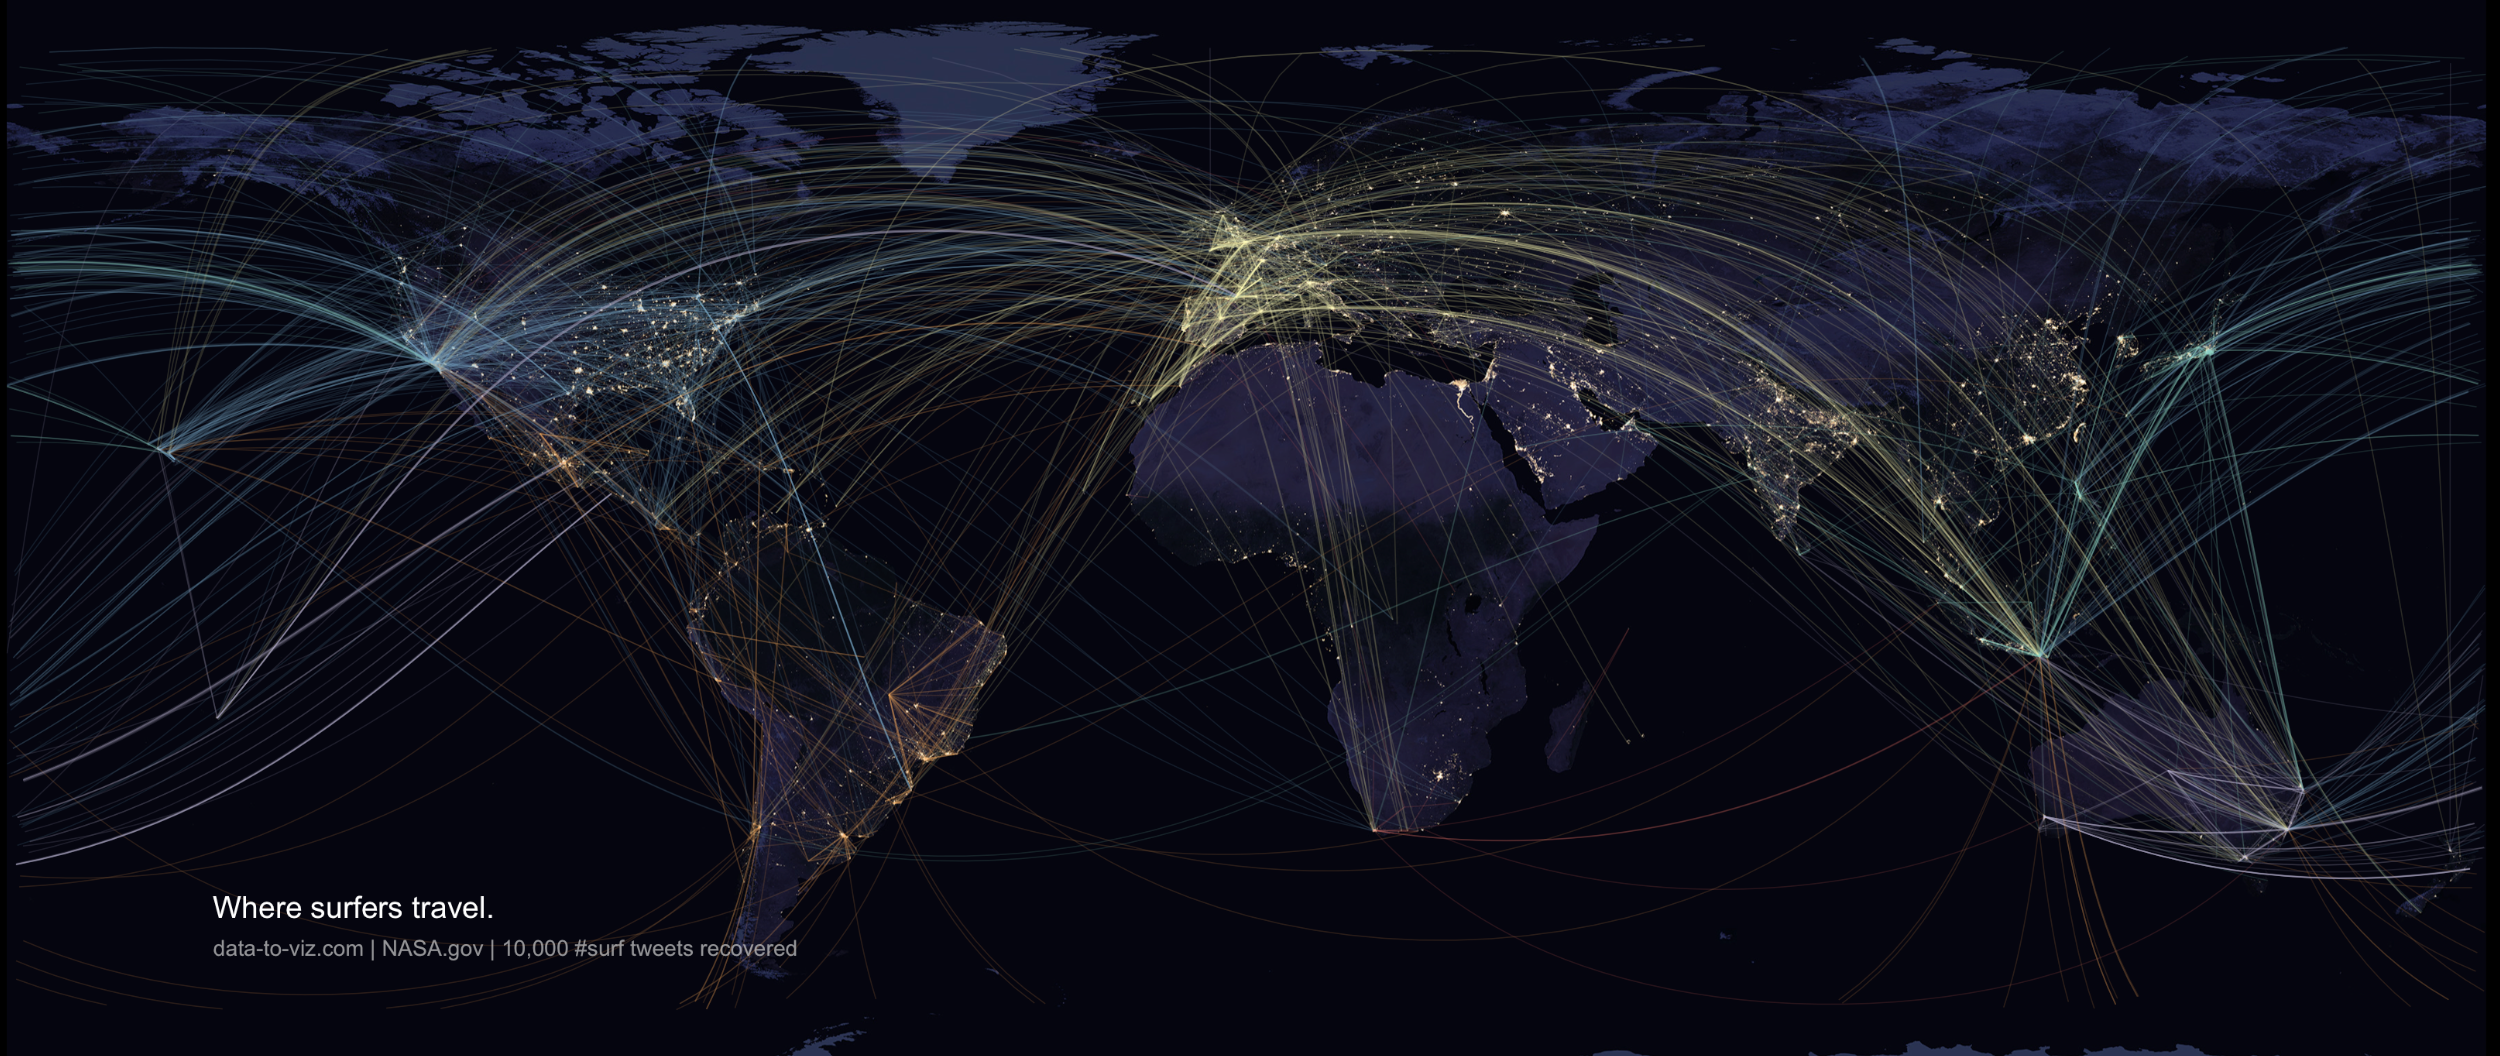
I am now working as a consultant and on my educational websites like data-to-viz.com, Productive R Workflow and the graph galleries.
Publications Talks Twitter GithubServices
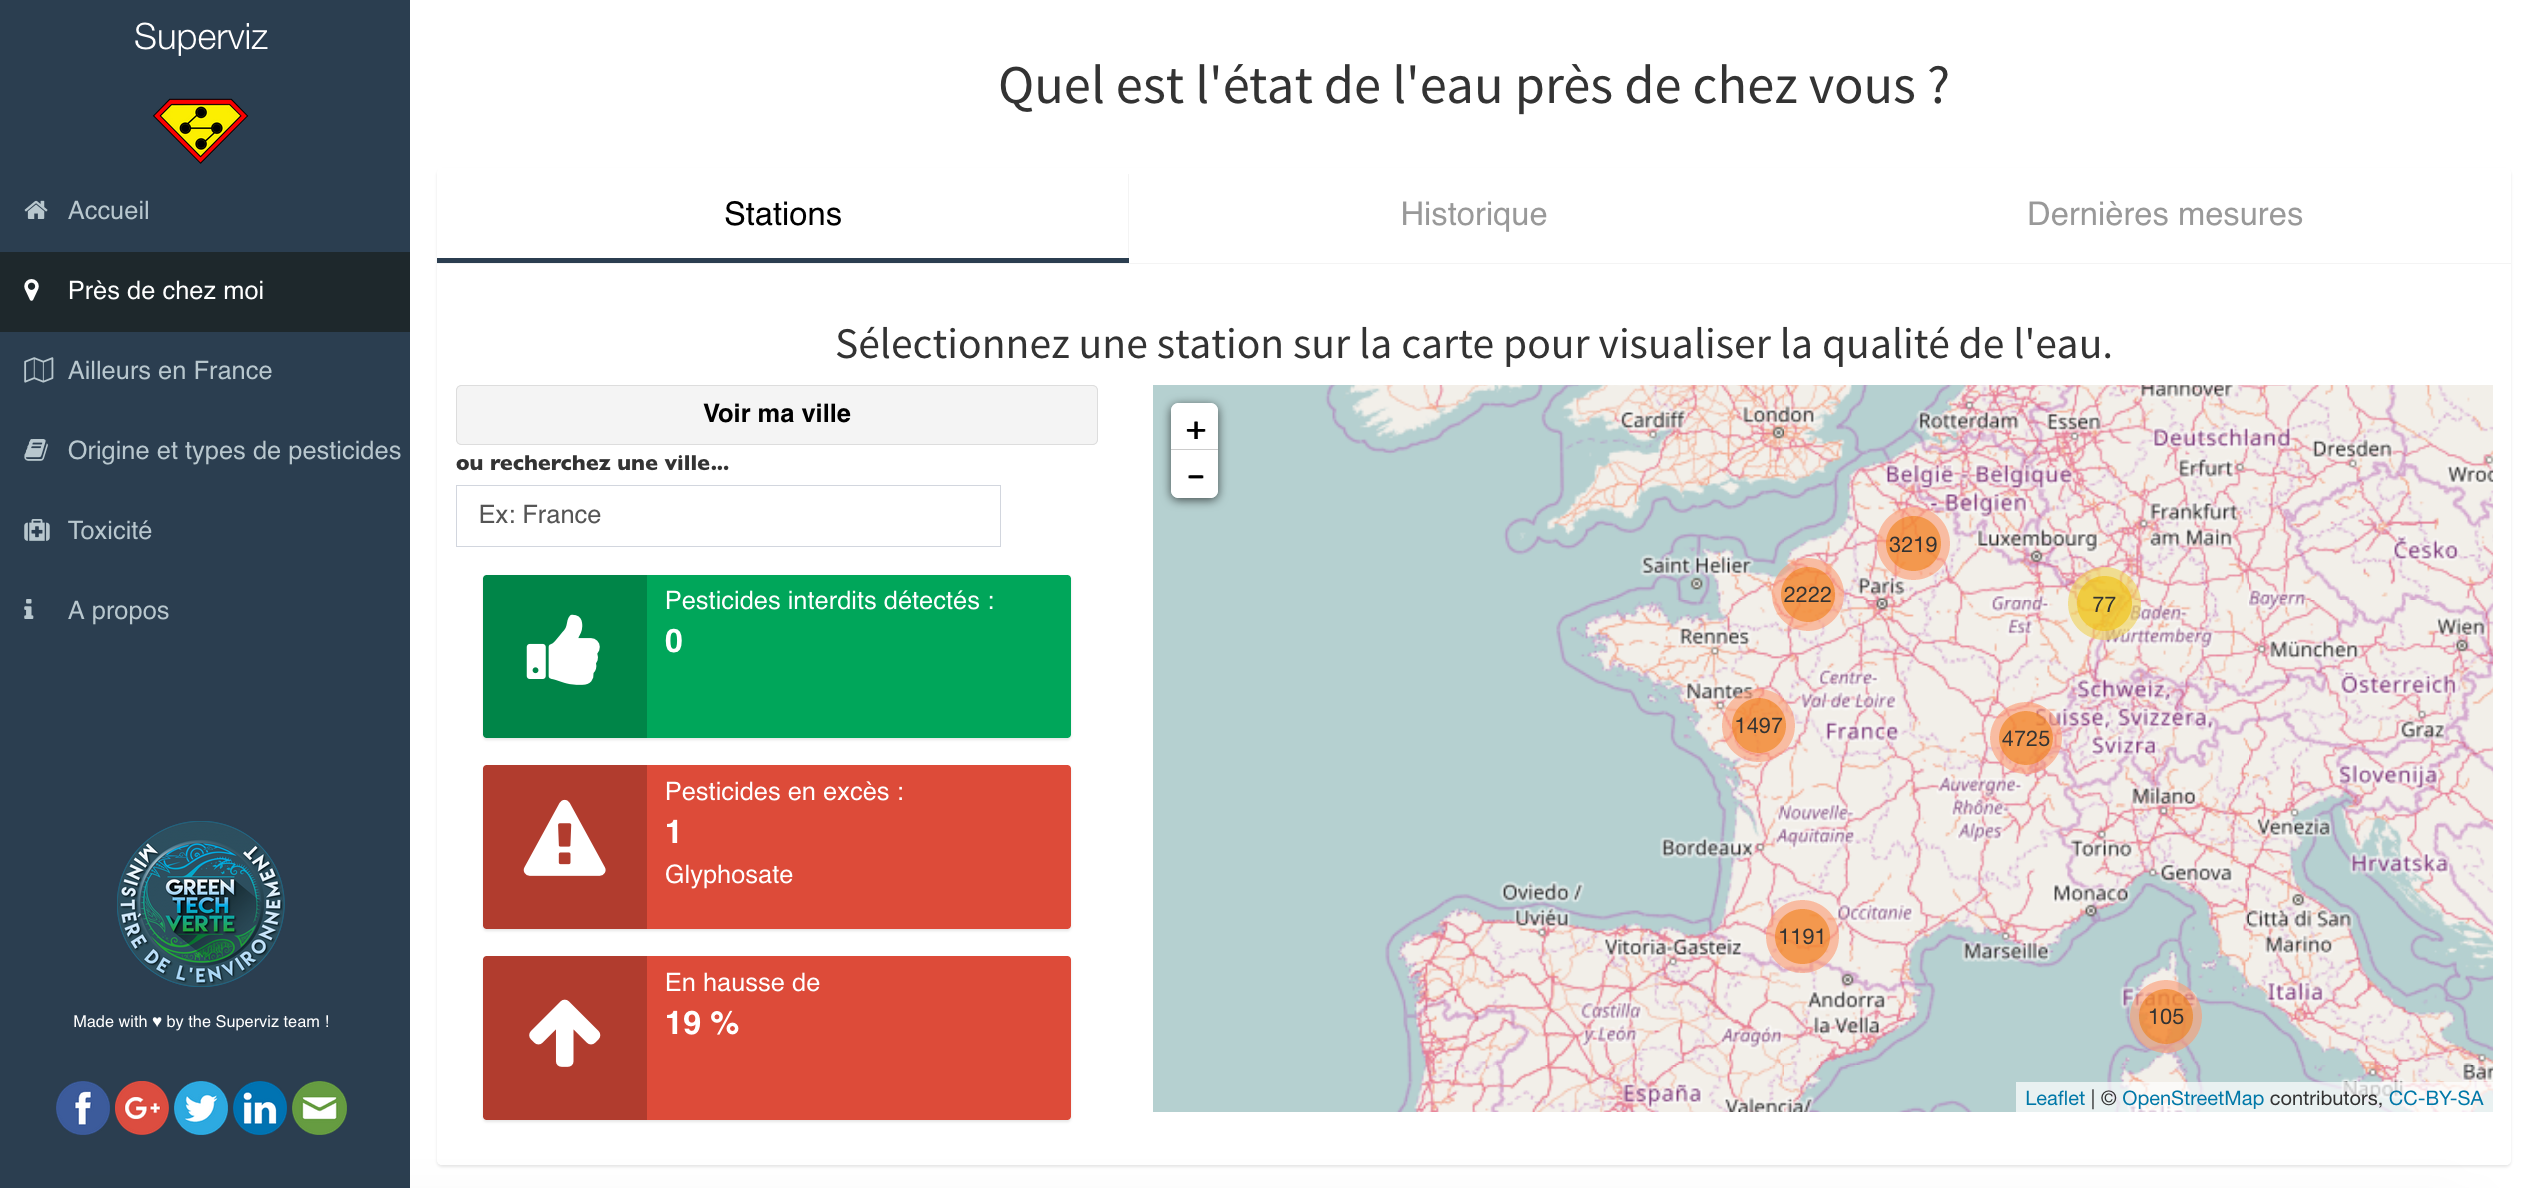
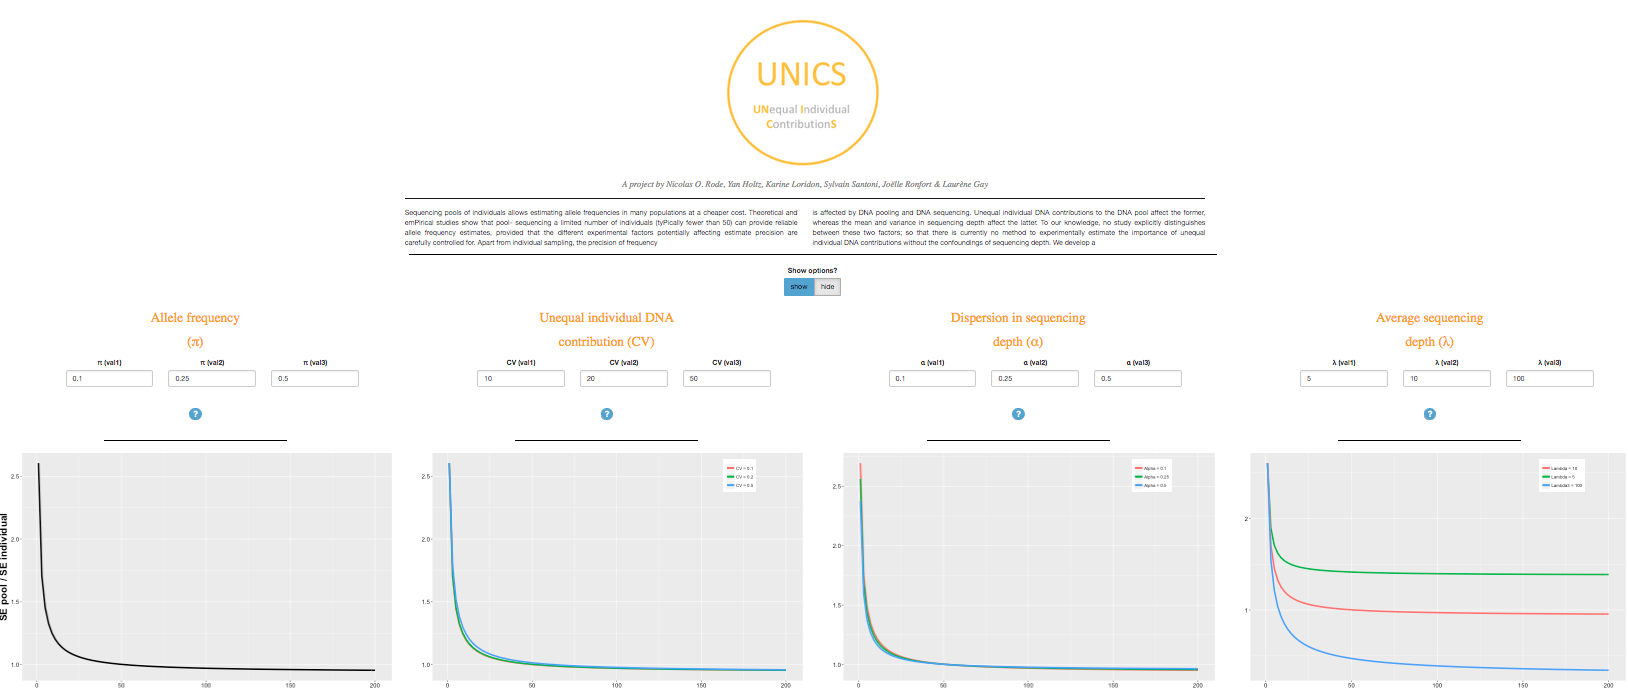
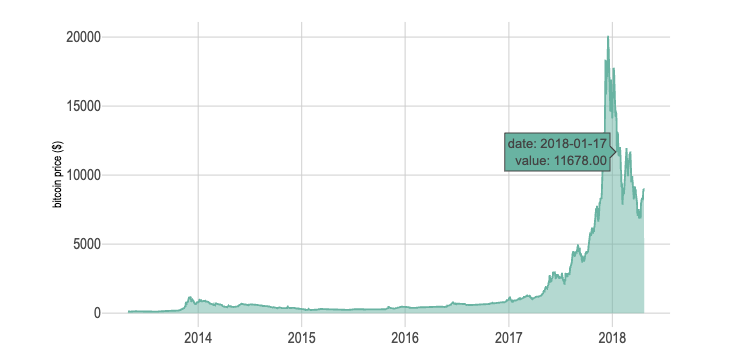
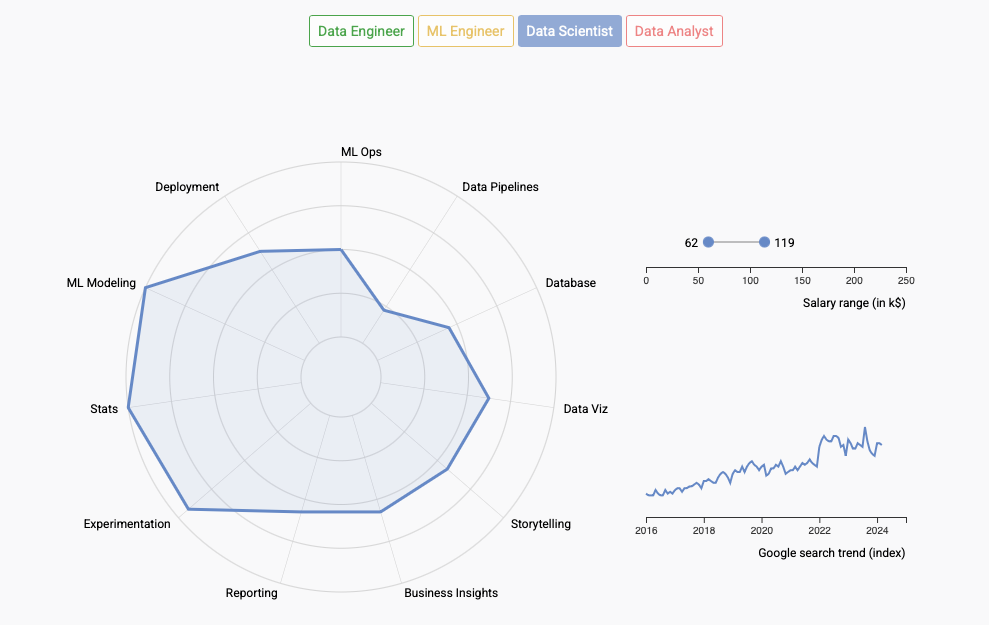
Need a custom interactive graph? Some R or React work? Creating beautiful reports with Quarto?
+Short talks or multi-day courses on dataviz, R, ggplot2, data analytics and more.
+Websites
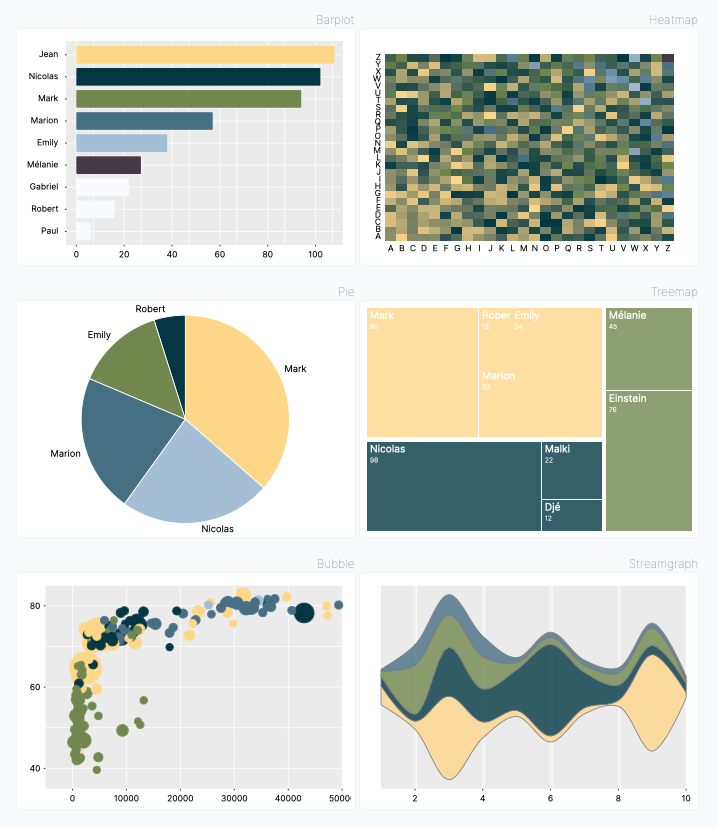
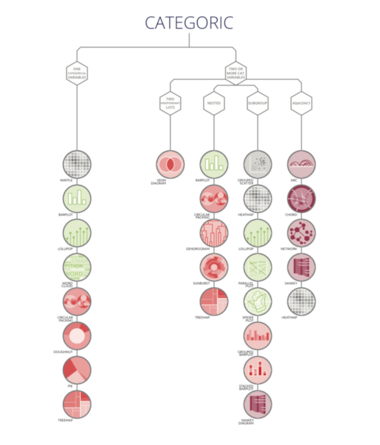
A classification of charts based on their input format, and a lot of tips and tricks.
Visit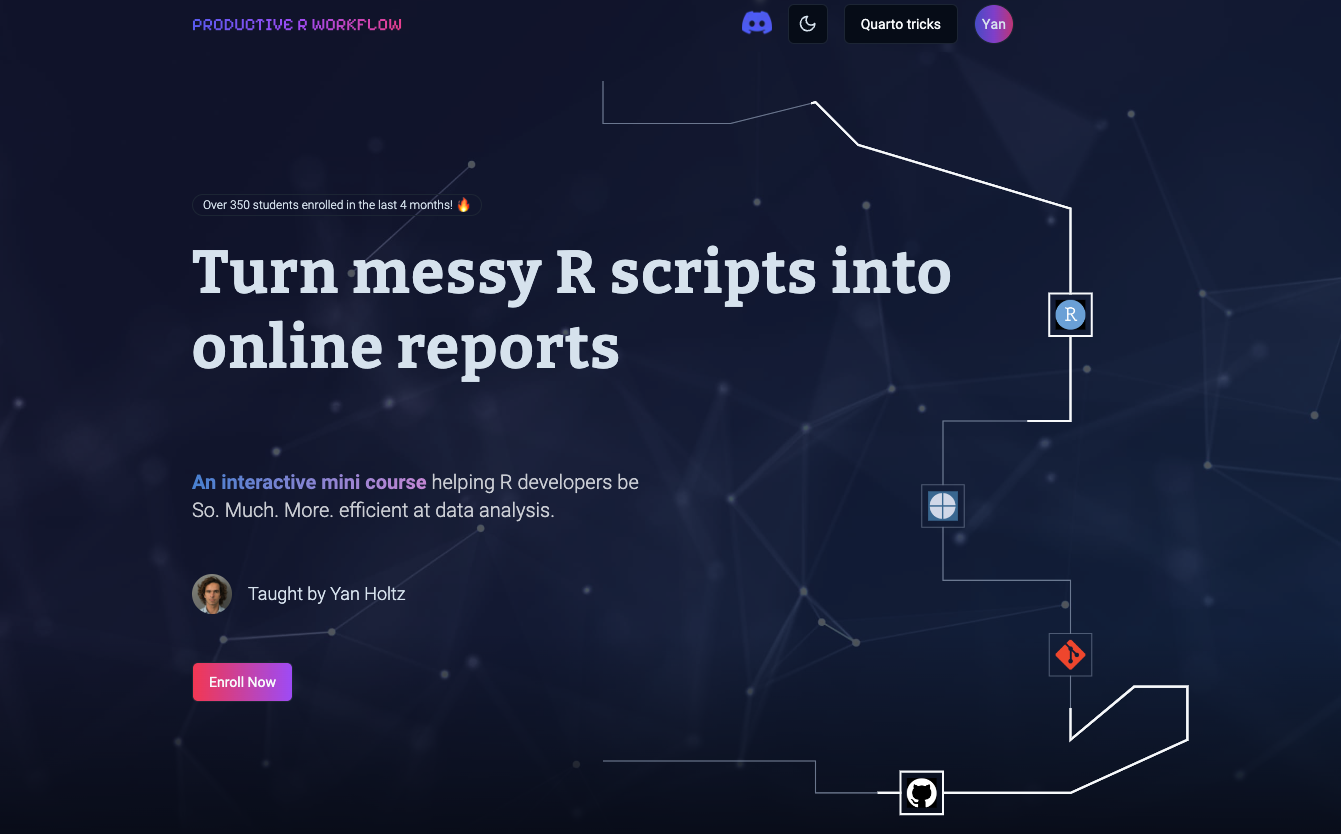
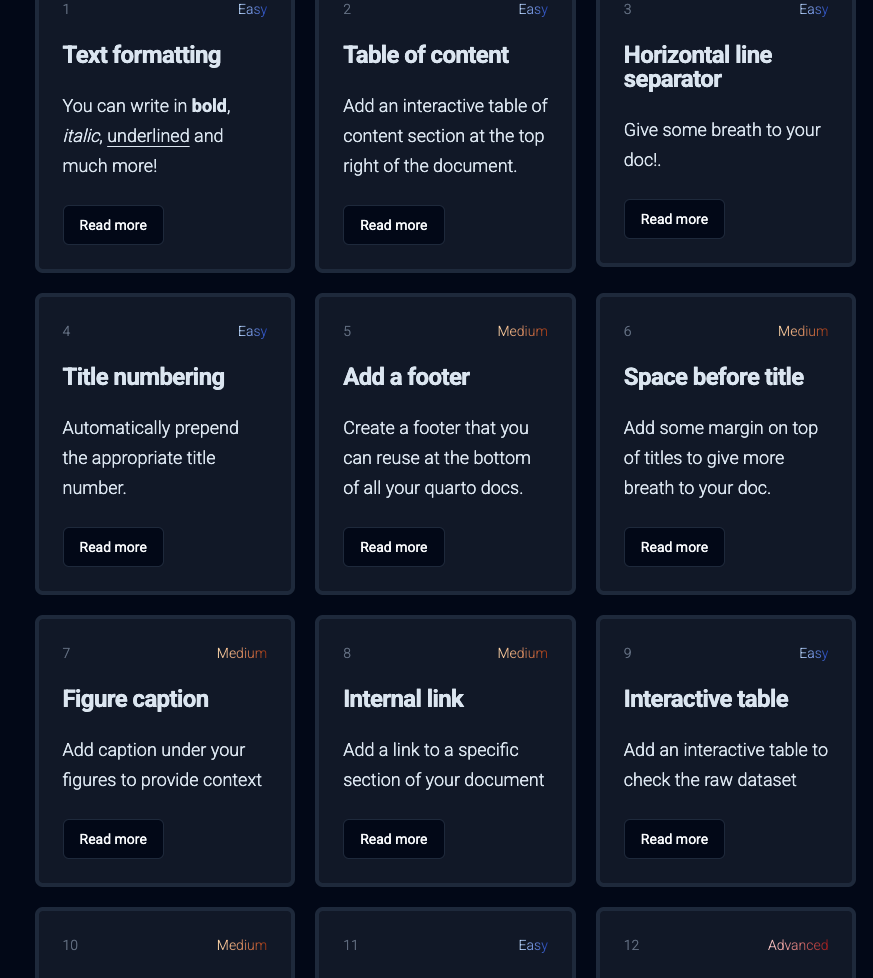
Productive R Workflow is my latest project.
It's an online course designed for R users, offering a comprehensive collection of best practices that are essential for enhancing your workflow.
Whether you or your team use R, dedicating a few hours to this course will be immensely beneficial and enjoyable.
Trust me and take a look!
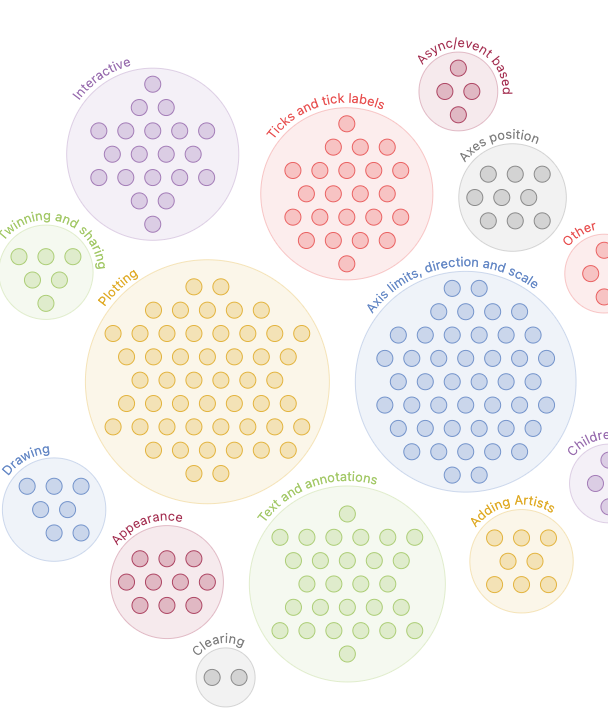
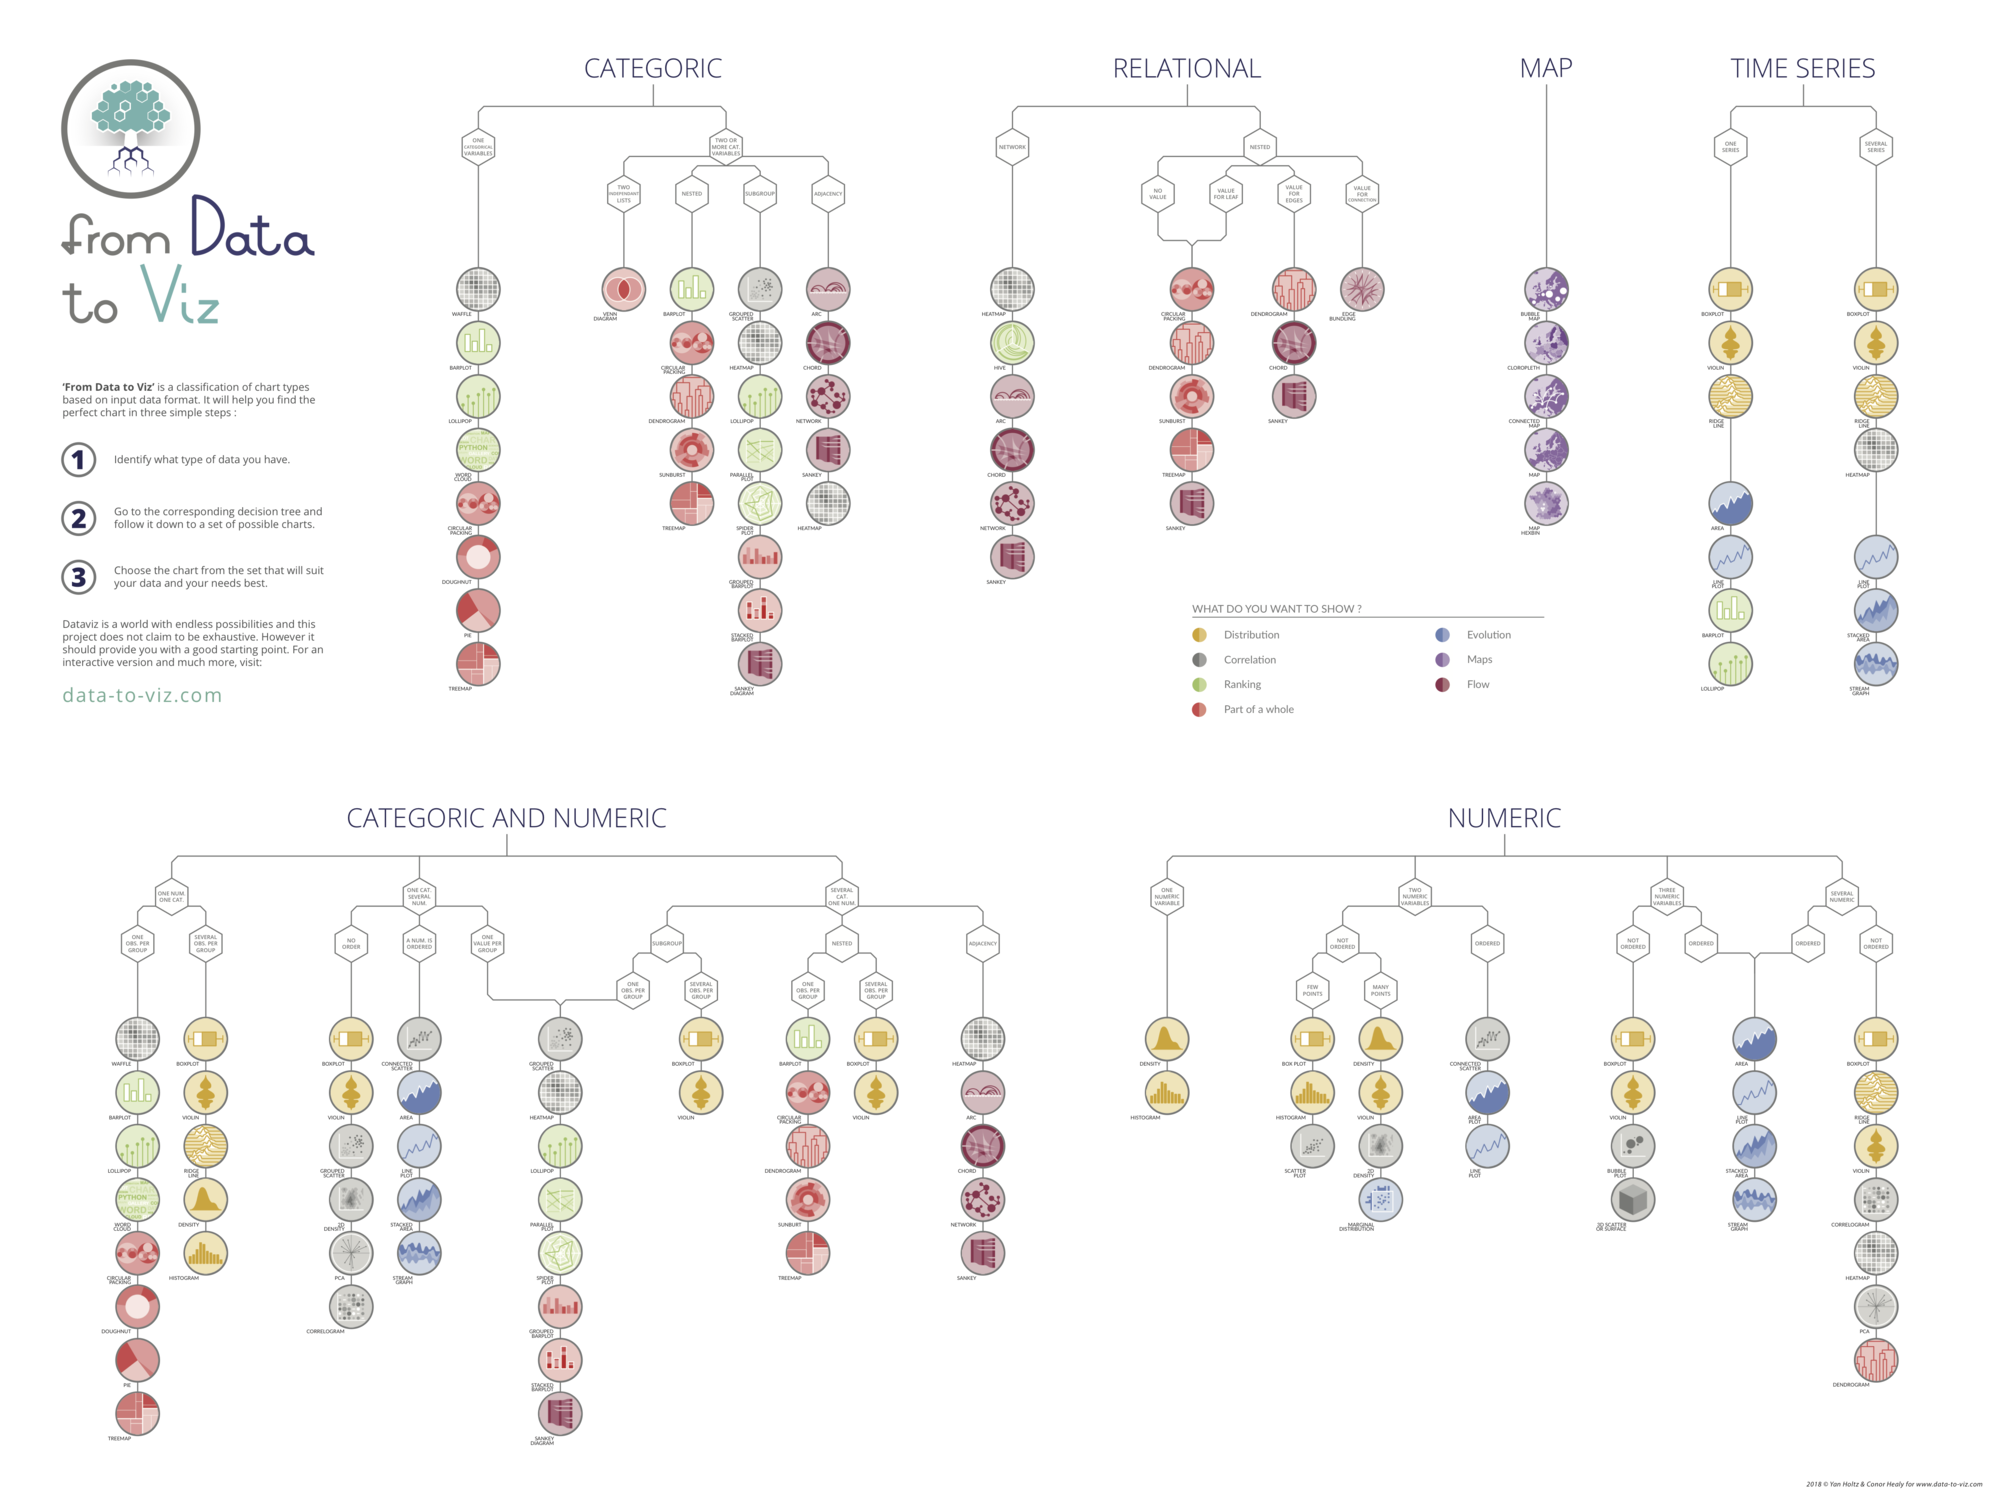
Be better at R, nowDataviz Decision Tree
Unsure which chart type to use for your dataset?
I've developed a comprehensive classification of chart types based on their required data input format.
This decision tree is available as a poster, which you can order online or receive via email instantly!
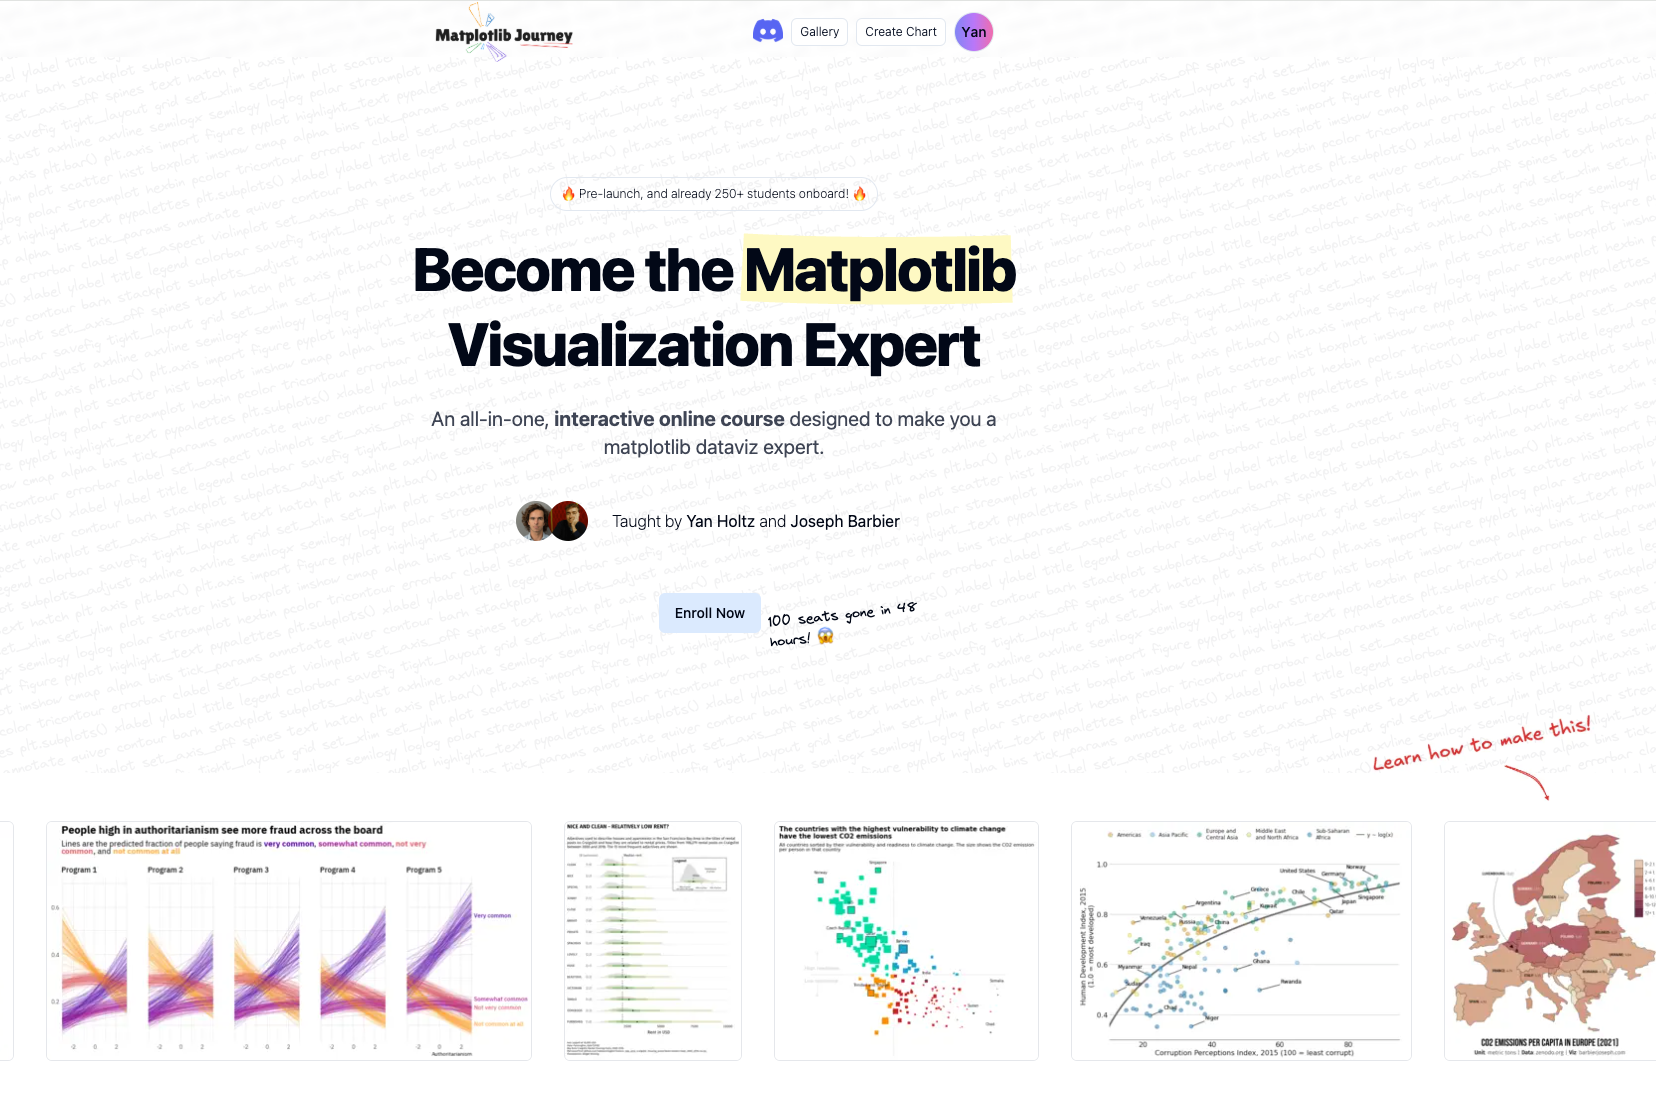
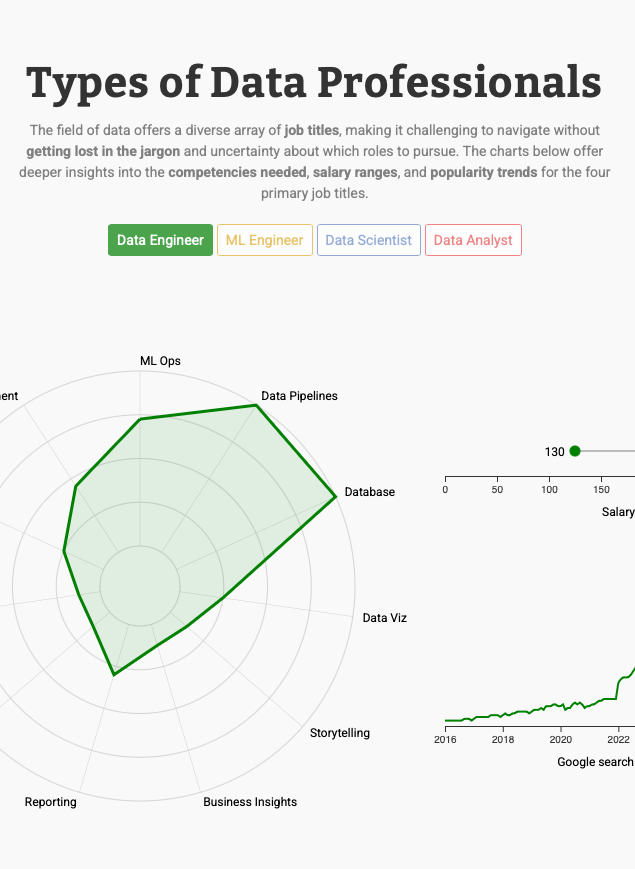
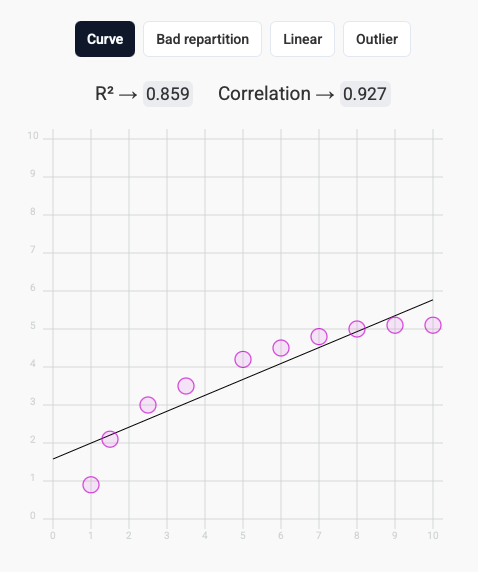
Matplotlib Journey is the online course I am currently developing.
It's an all-in-one, interactive course designed to make you a Matplotlib data visualization expert. Comprehensive and highly interactive, this is probably the project I'm most proud of!
If you're a Python user, you'll love it! ❤️
Learn Matplotlib
"[...] Yan did an absolutely brilliant job. He has multiple skills and qualities making him a great data science project member, and even leader : excellent knowledge and learning ability of diverse statistical and data management tools obviously, and a real knack for data viz."
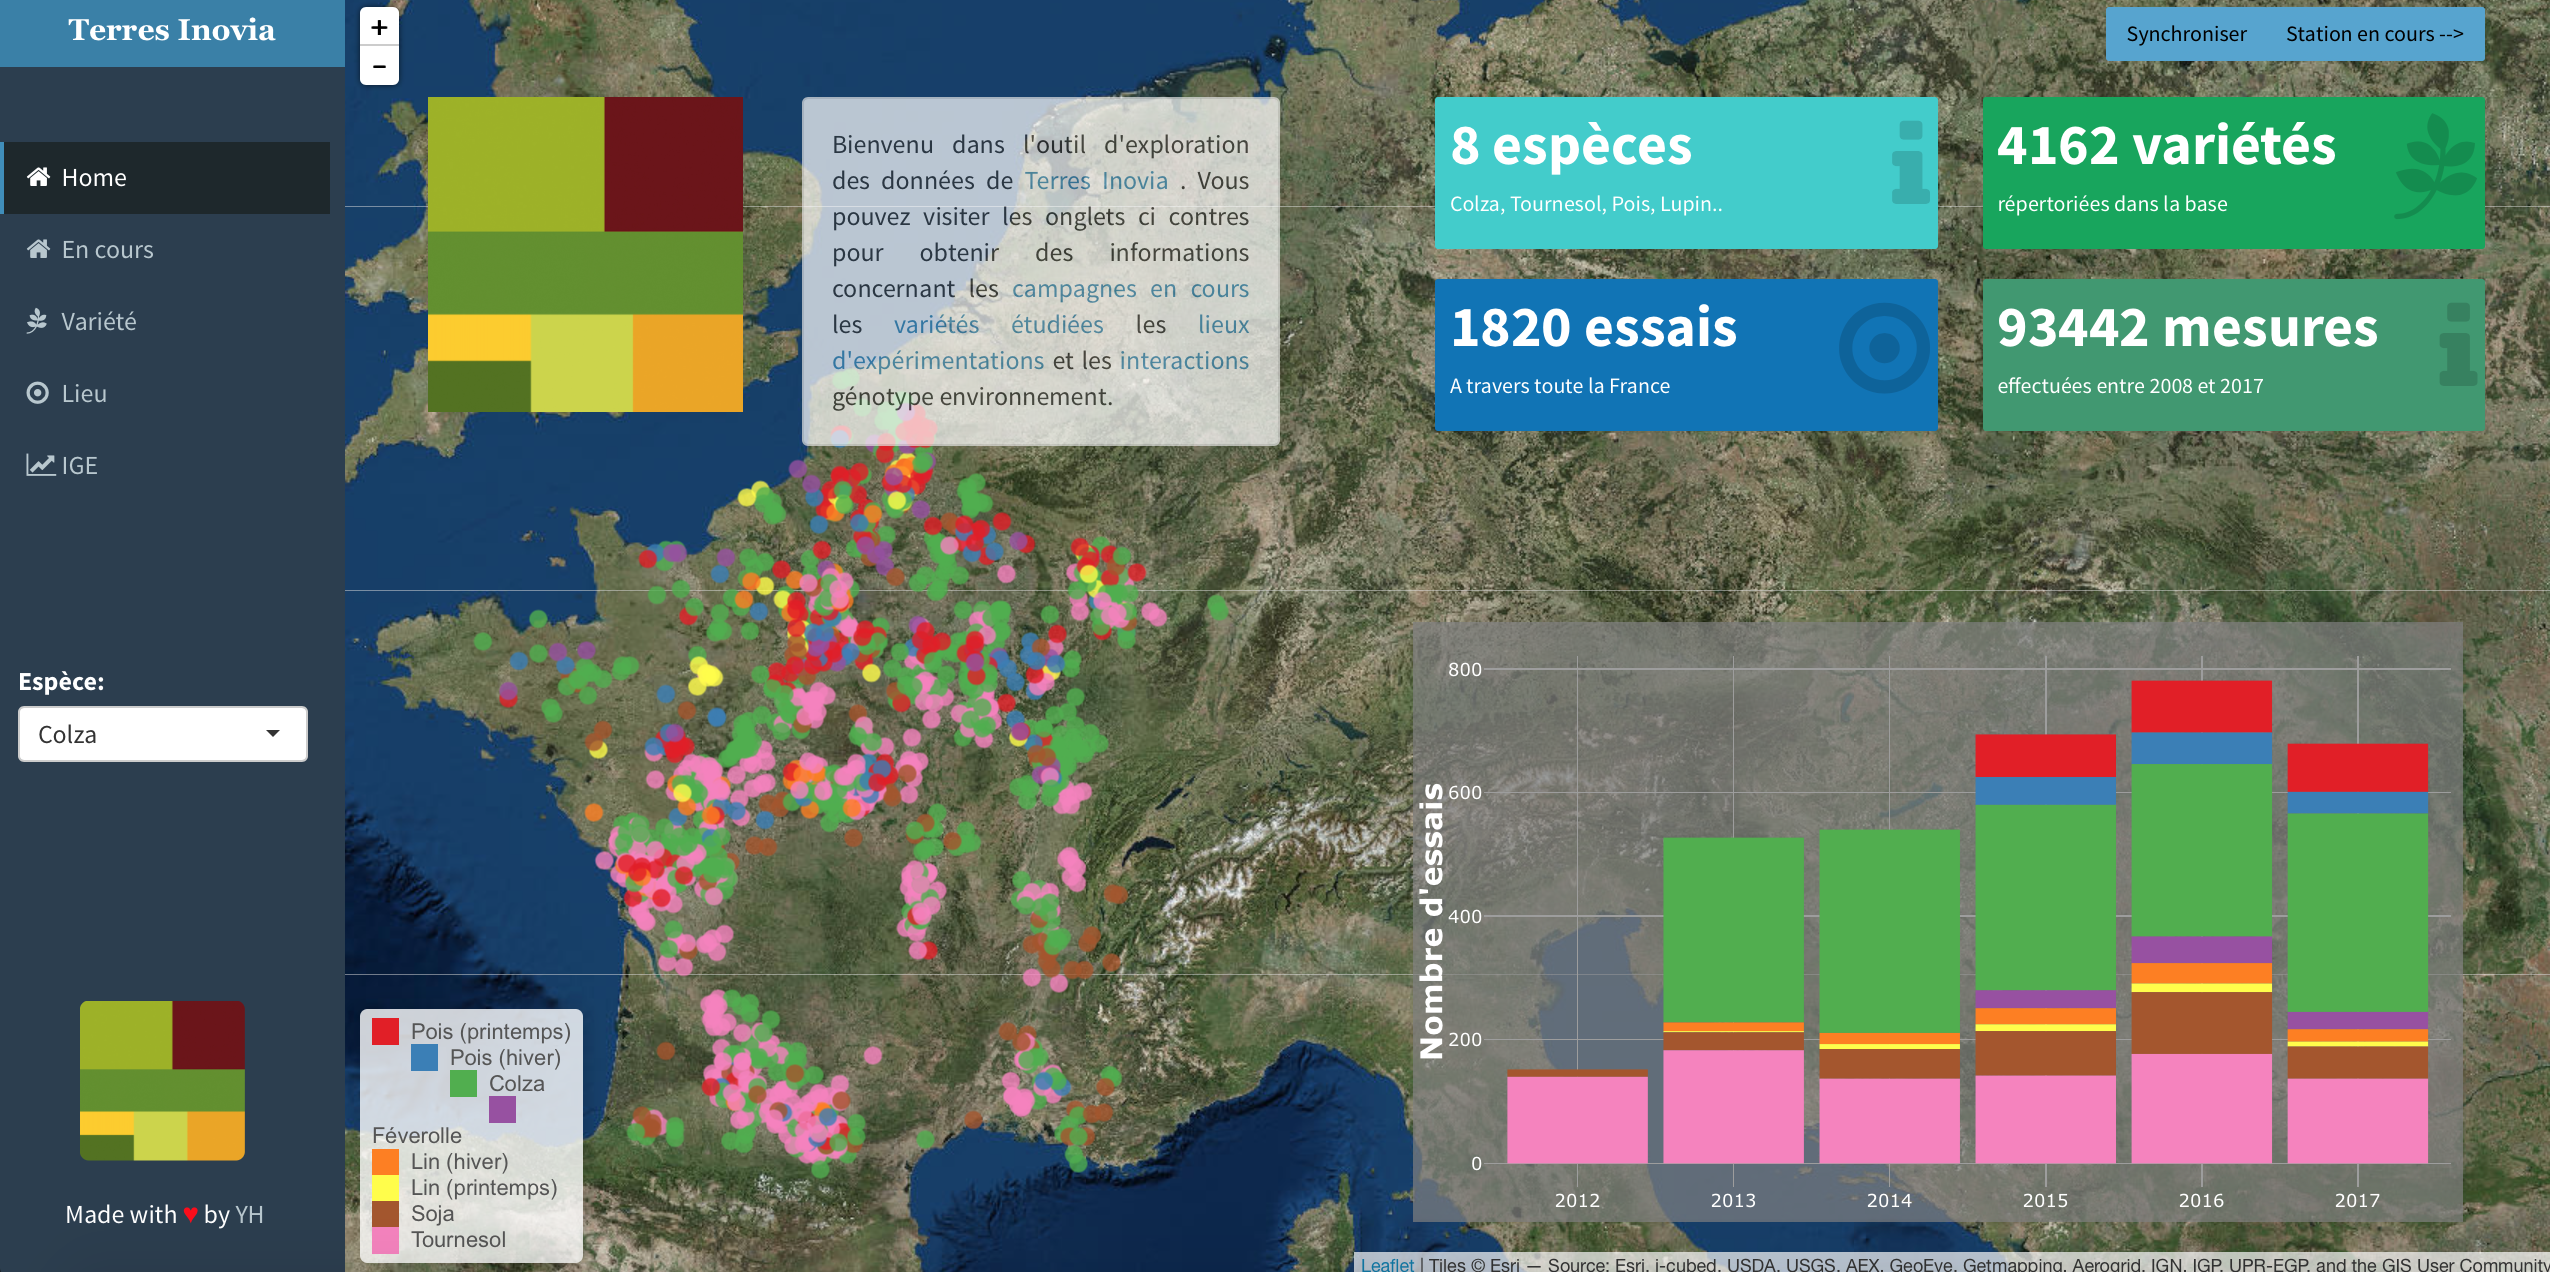
D. Gouache - Deputy Director at Terres Inovia

"Yan always performed with outstanding skills and impressive capacity for adaptation and efficiency. His job was crucial for the publication of important results. [...] I thus highly recommend him for any work concering framing and analysis of huge data sets."
J. David - Professor at Montpellier Supagro

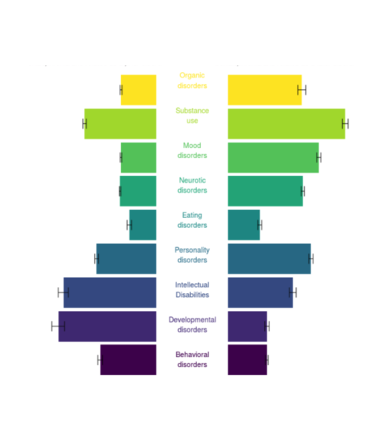
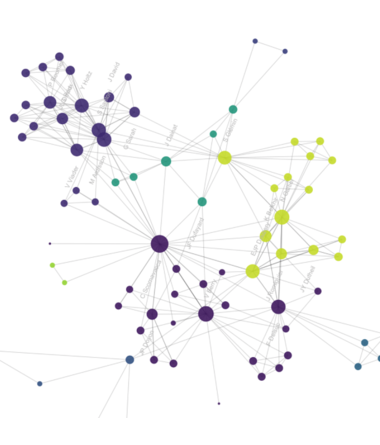
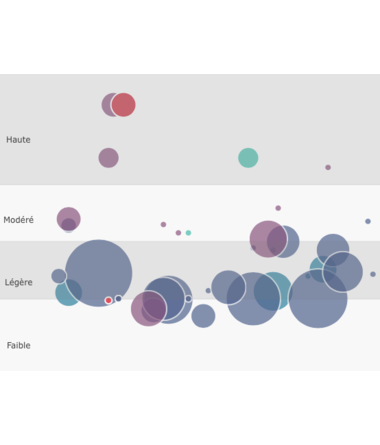
"Yan has taught me everything I know about data visualization!
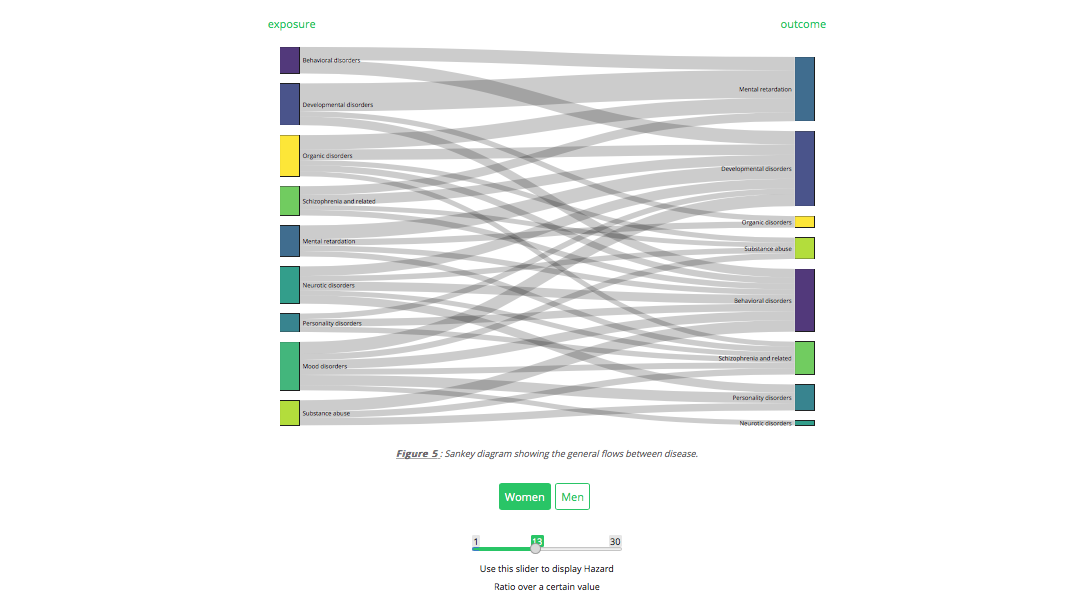
He taught my group how to display data in clever ways, and has been responsible for our recent
interactive website related to psychiatric epidemiology.
Also, he is a super-fast and
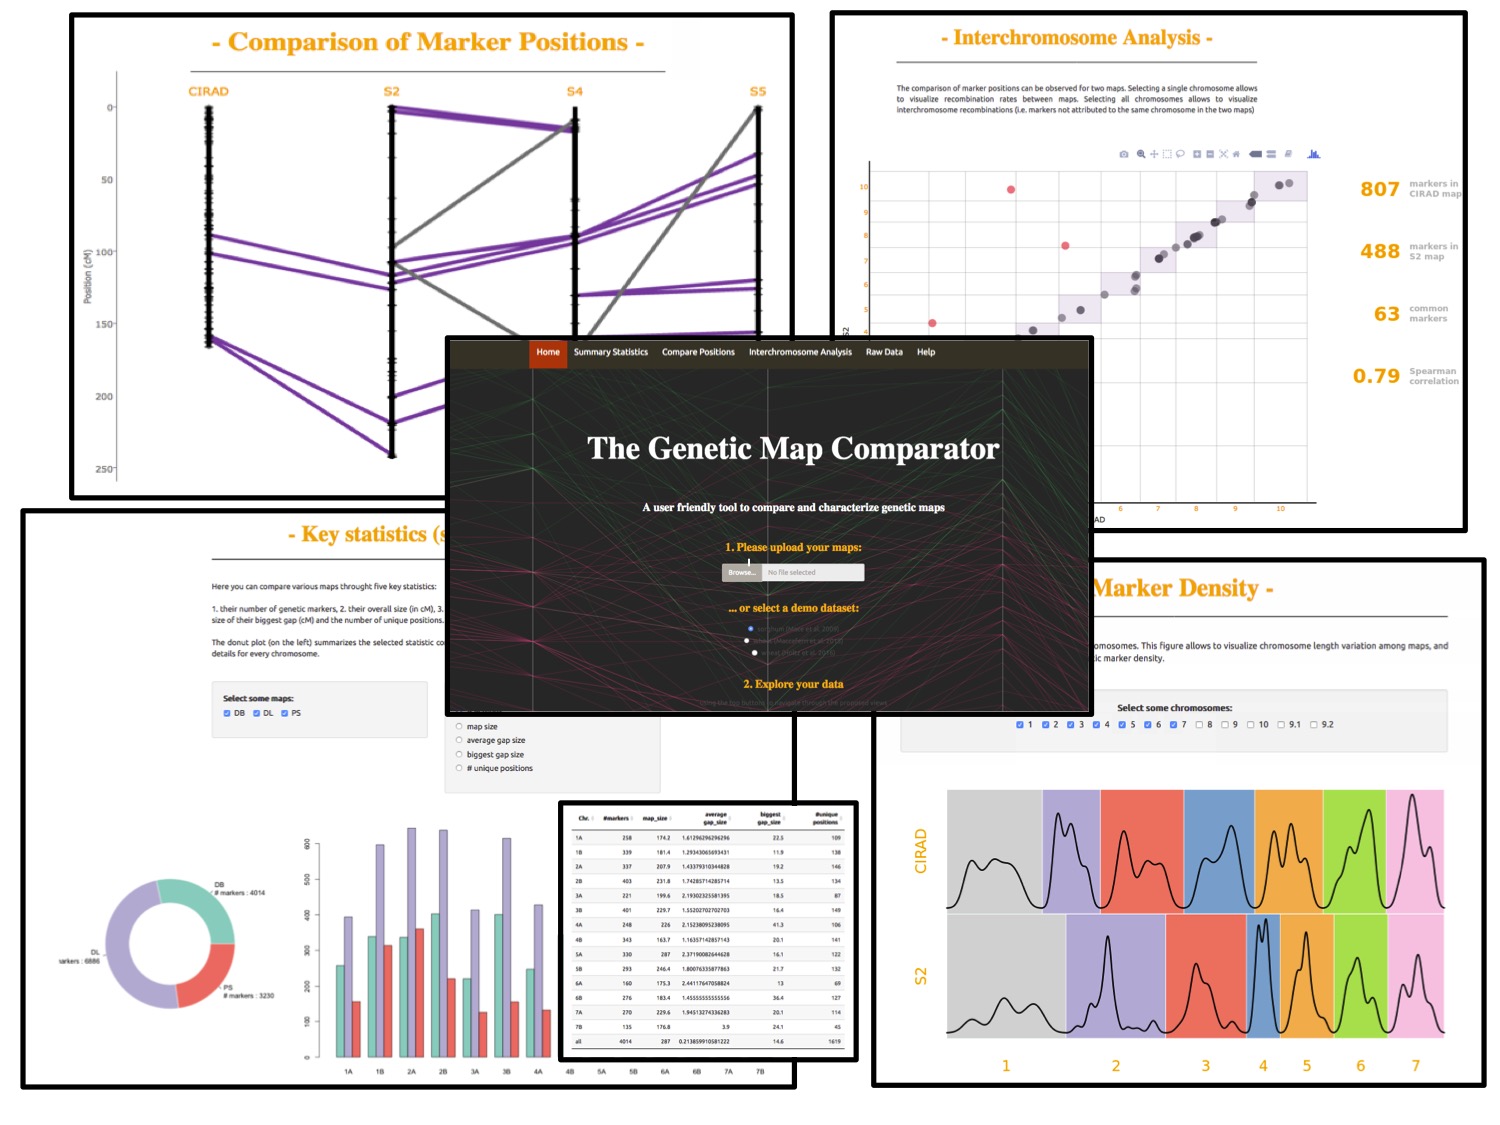
efficient bioinformatician. He has set up a pipeline to handle large genetic datasets and apply
modern analytic methods to explore the genetic architecture of traits and disorders.
He is a
super-bright guy – I can highly recommend him!"
John McGrath - Senior Researcher at the Queensland Brain Institute