Consulting
I design and build
bespoke, interactive data visualizations for the web:
custom dashboards, data explorers and charts that
off-the-shelf tools can't deliver. A modern stack
(D3.js + React), tailored to your data and
your users.
What I can build for you
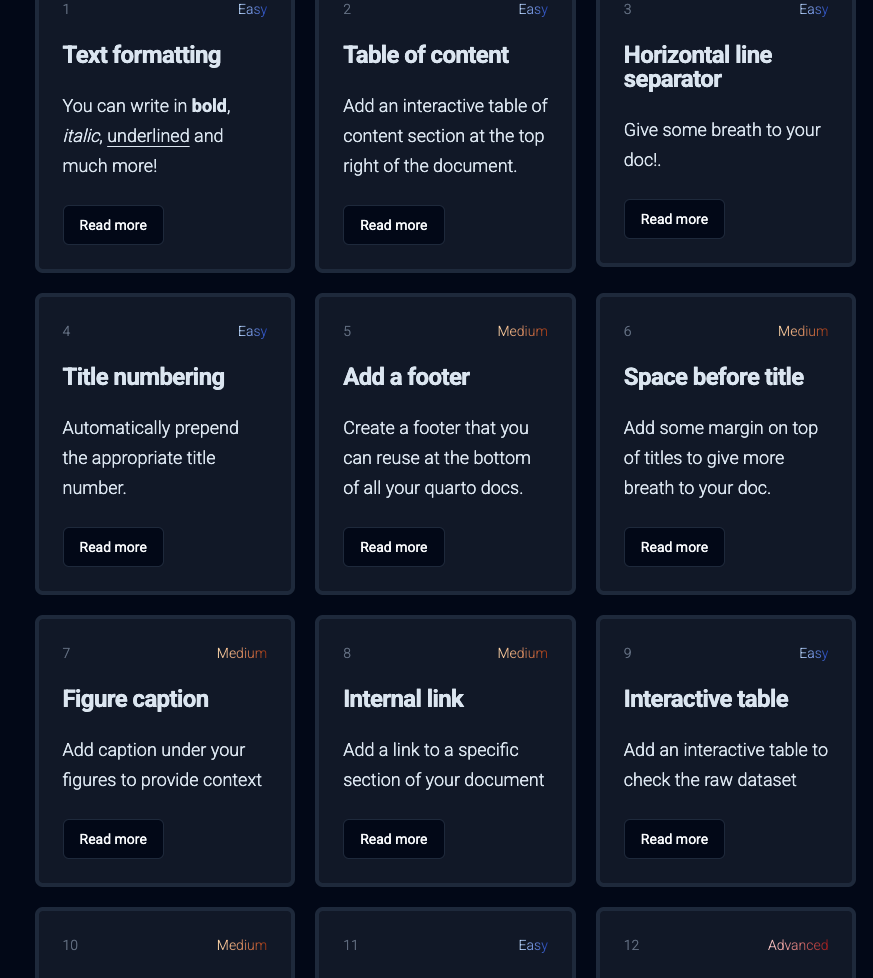
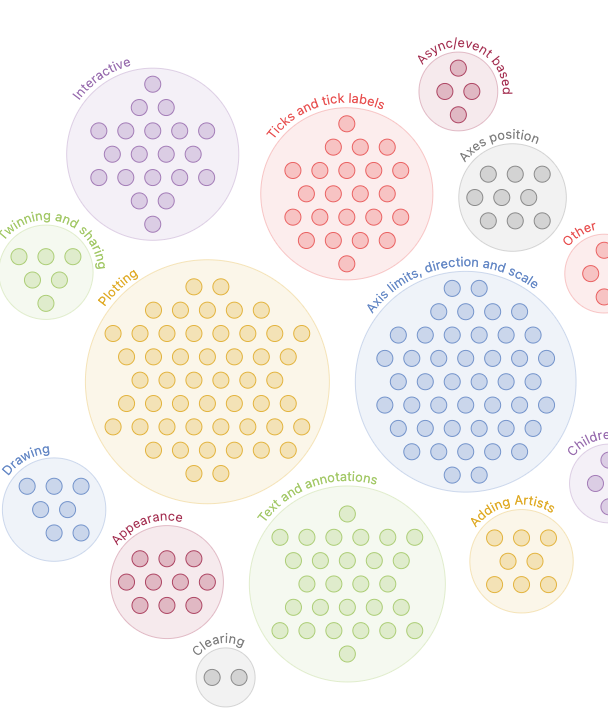
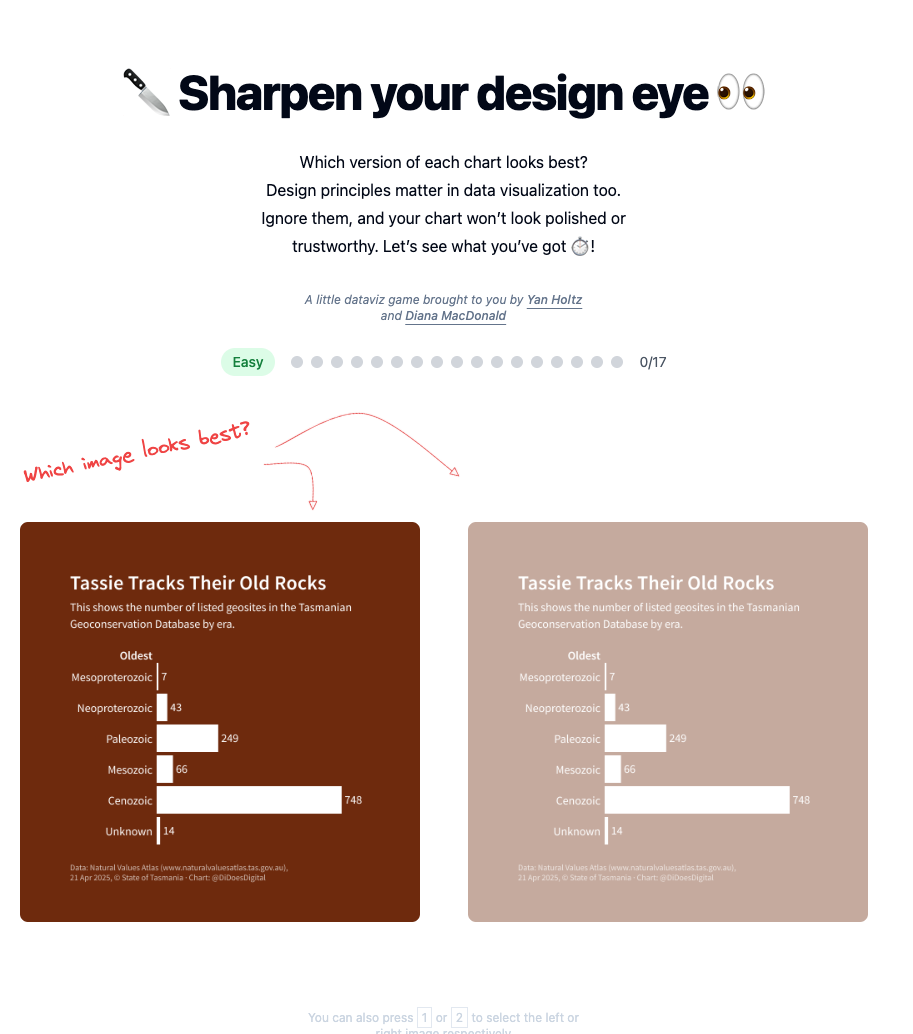
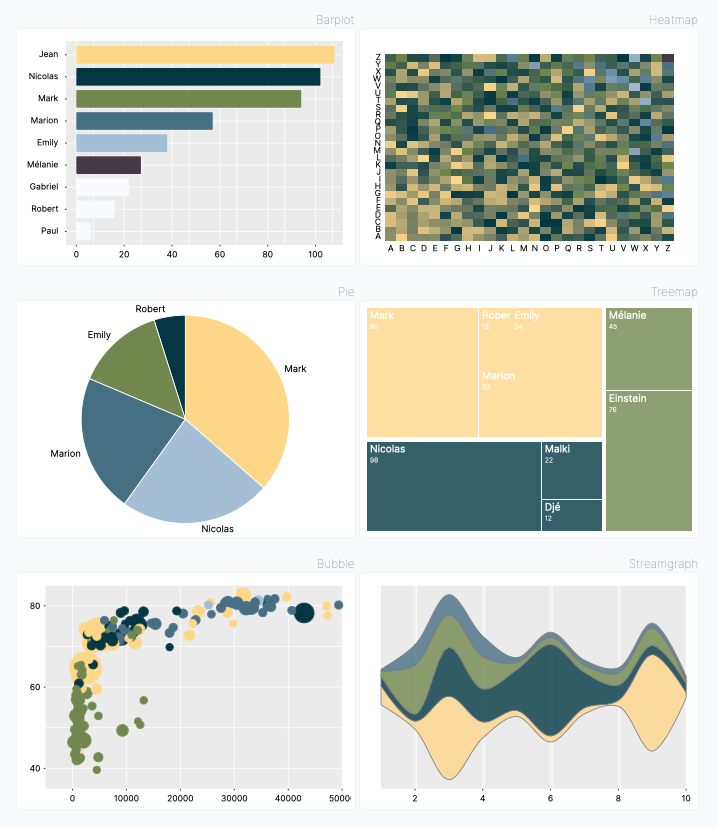
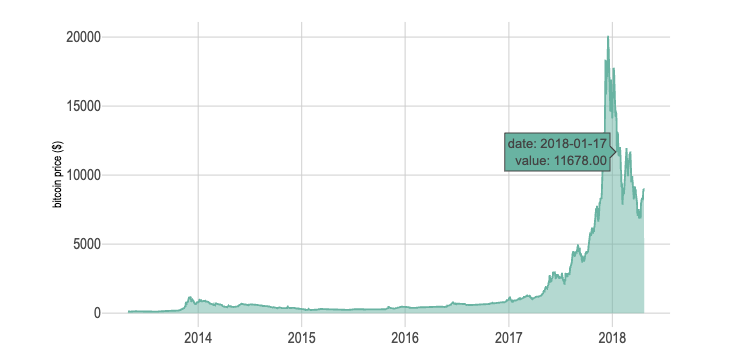
Custom charts & dataviz
Pixel-perfect, on-brand, interactive charts for the
web, built with D3.js.
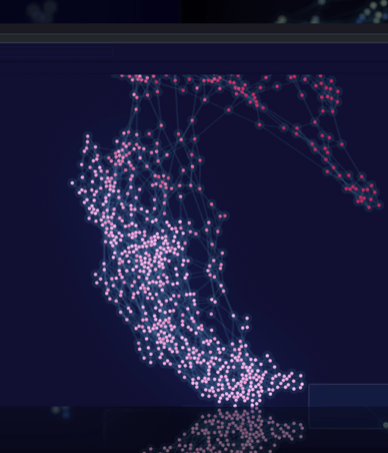
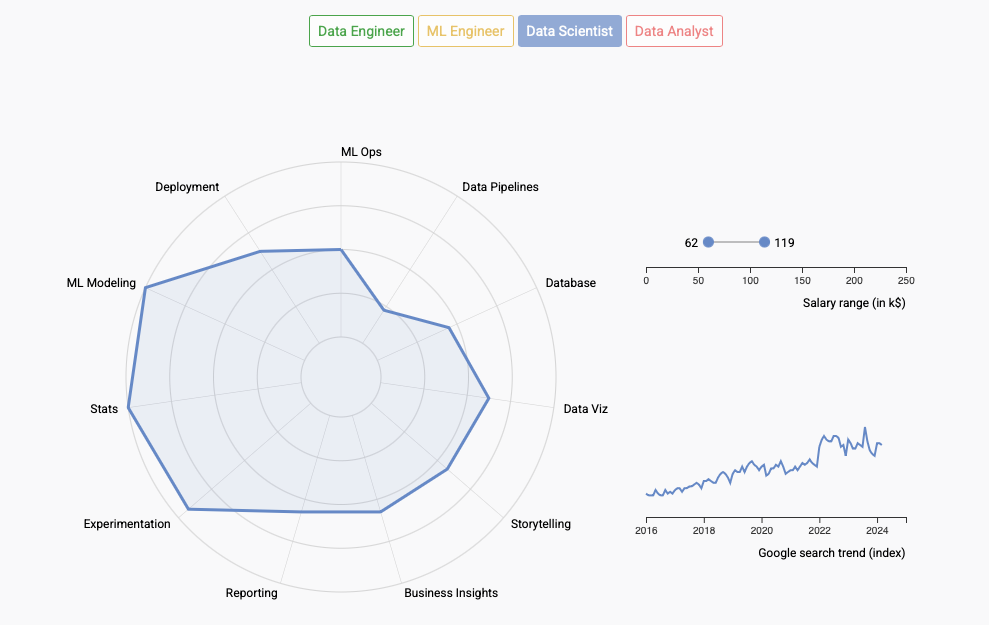
Data-exploration dashboards
Dashboards that let your users and your team truly
dig into the data.
Shiny app rebuilds
Migrating clunky R Shiny prototypes into fast,
polished React + D3 web apps.
Selected work
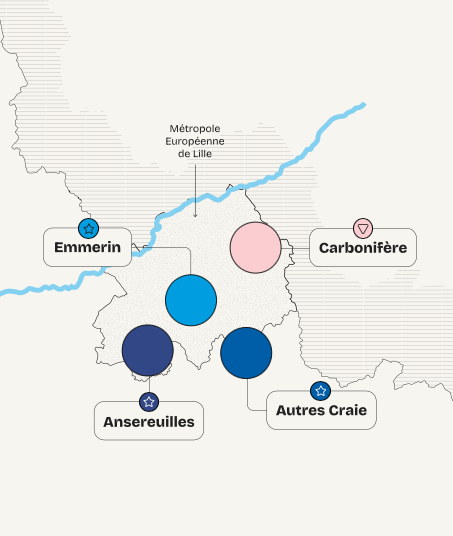
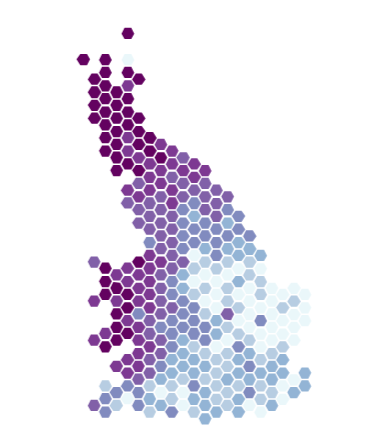
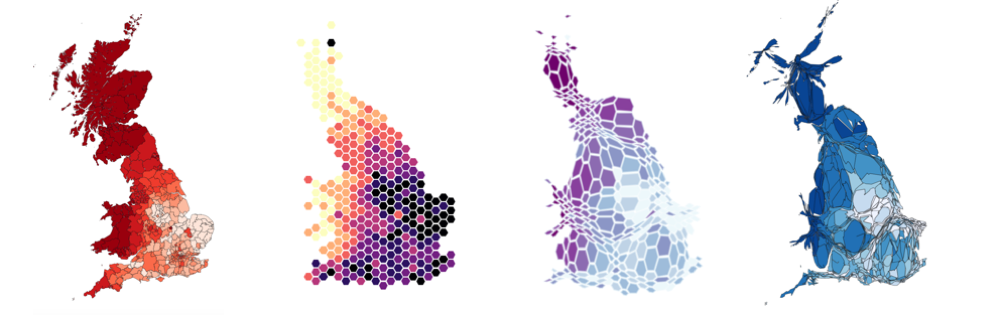
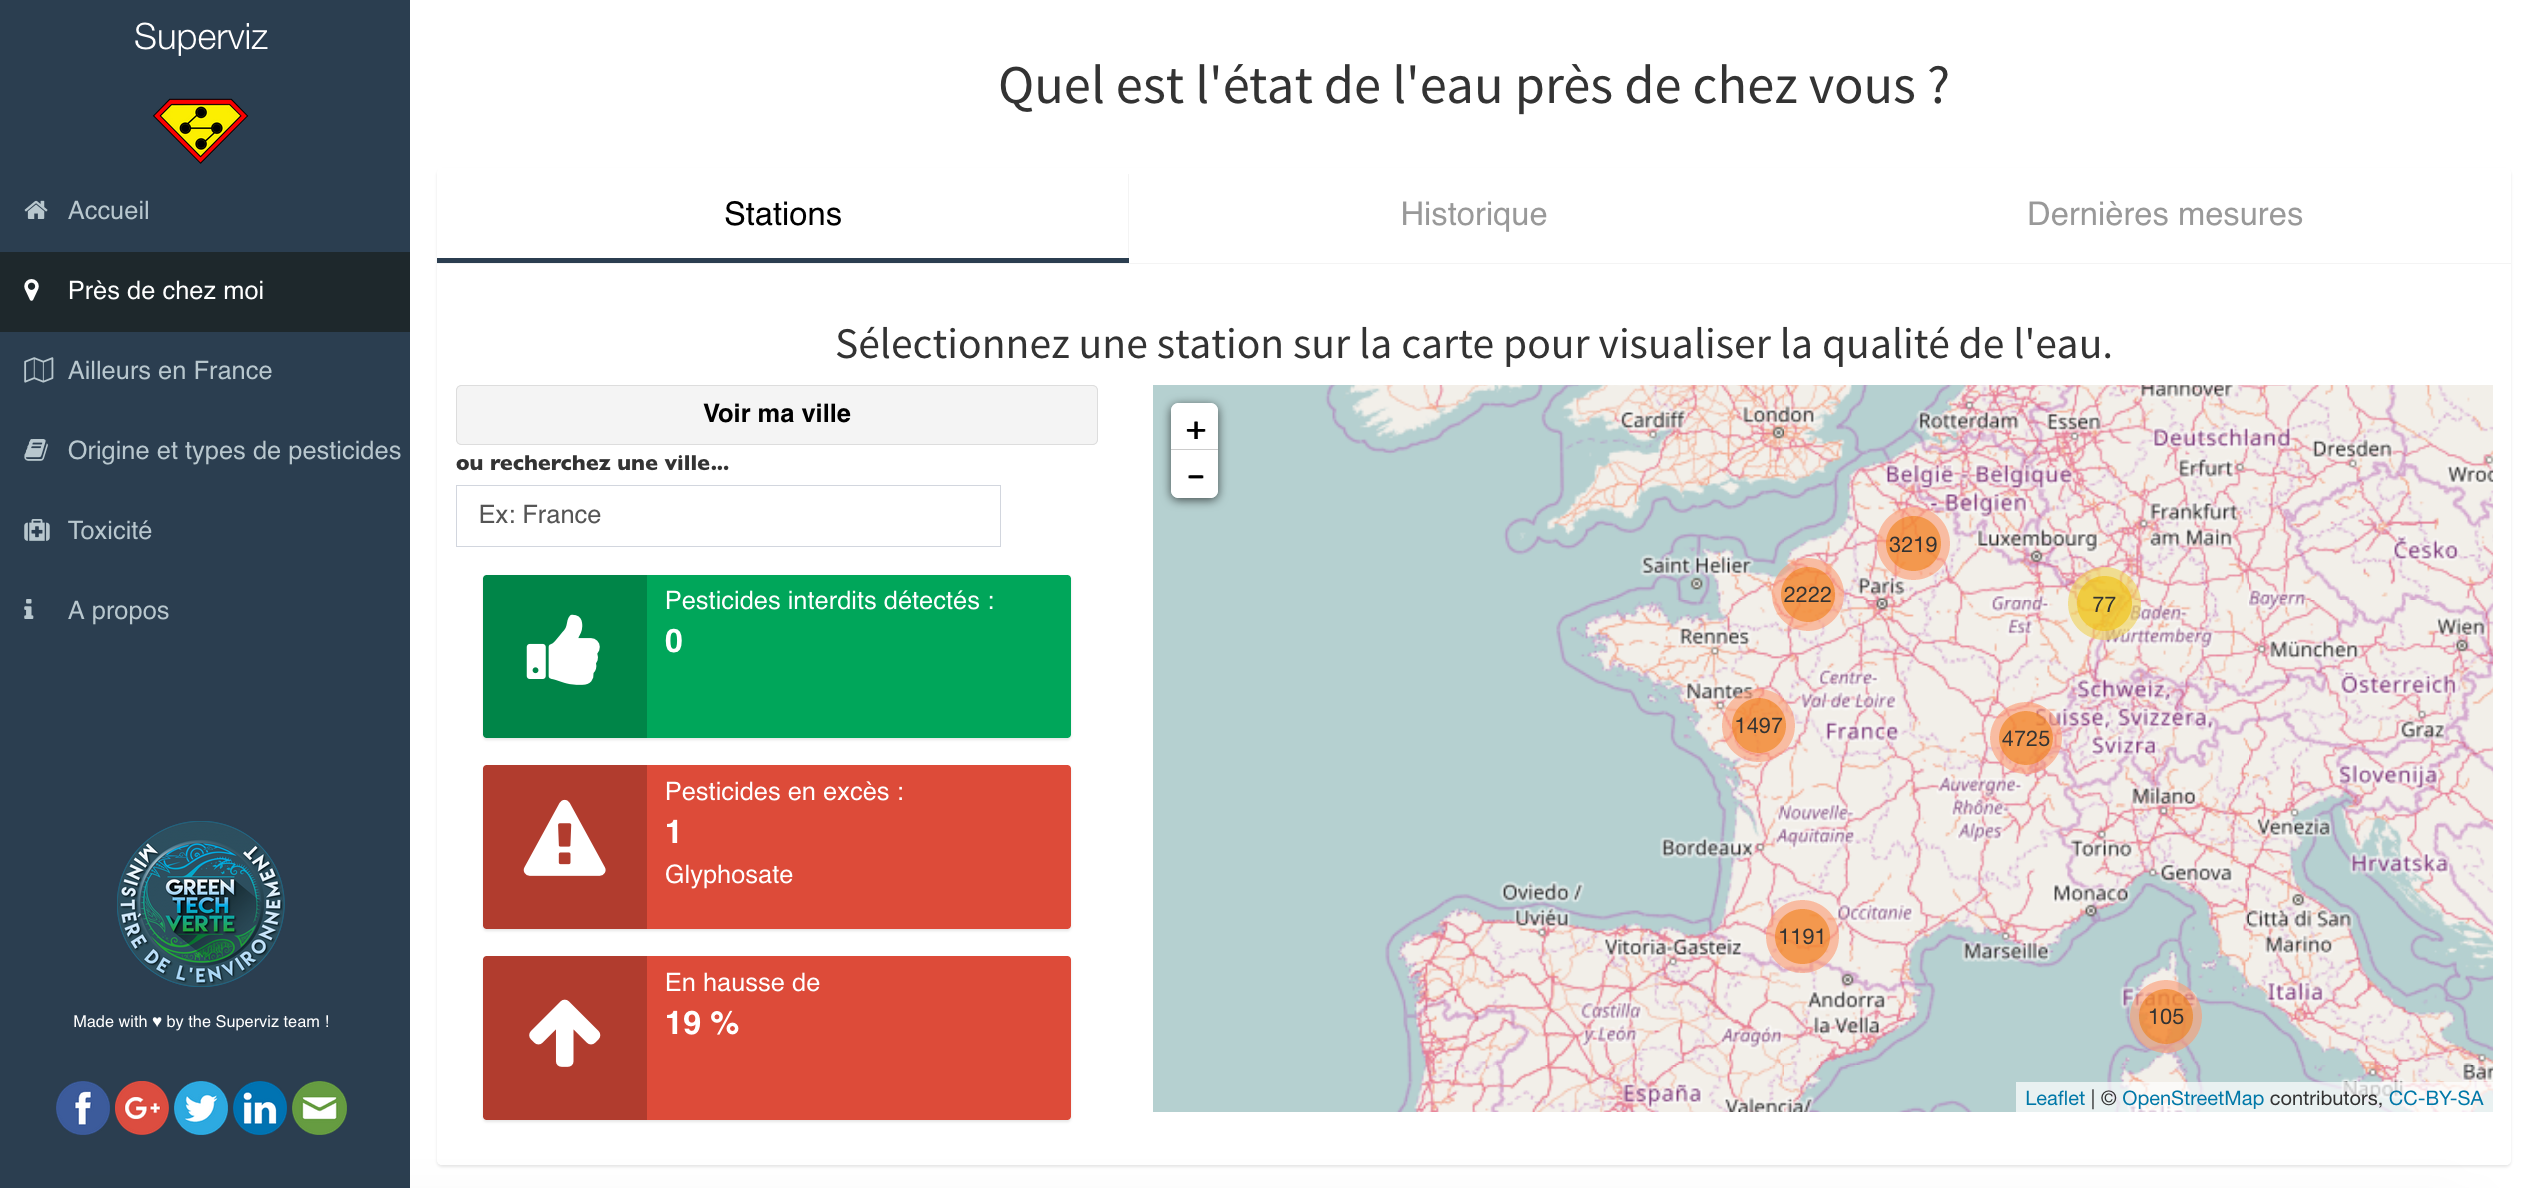
Proptech Analytics — an interactive app for the
property asset-management industry, letting users explore
UK construction & development data.
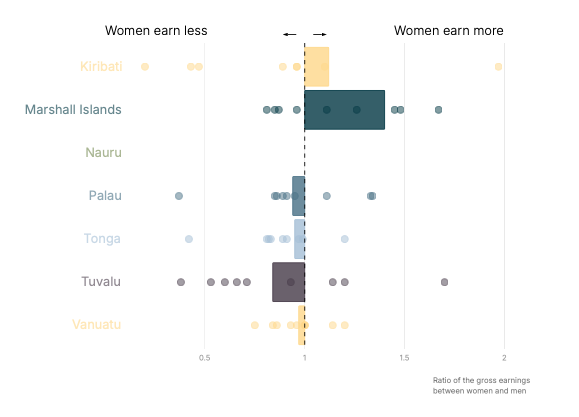
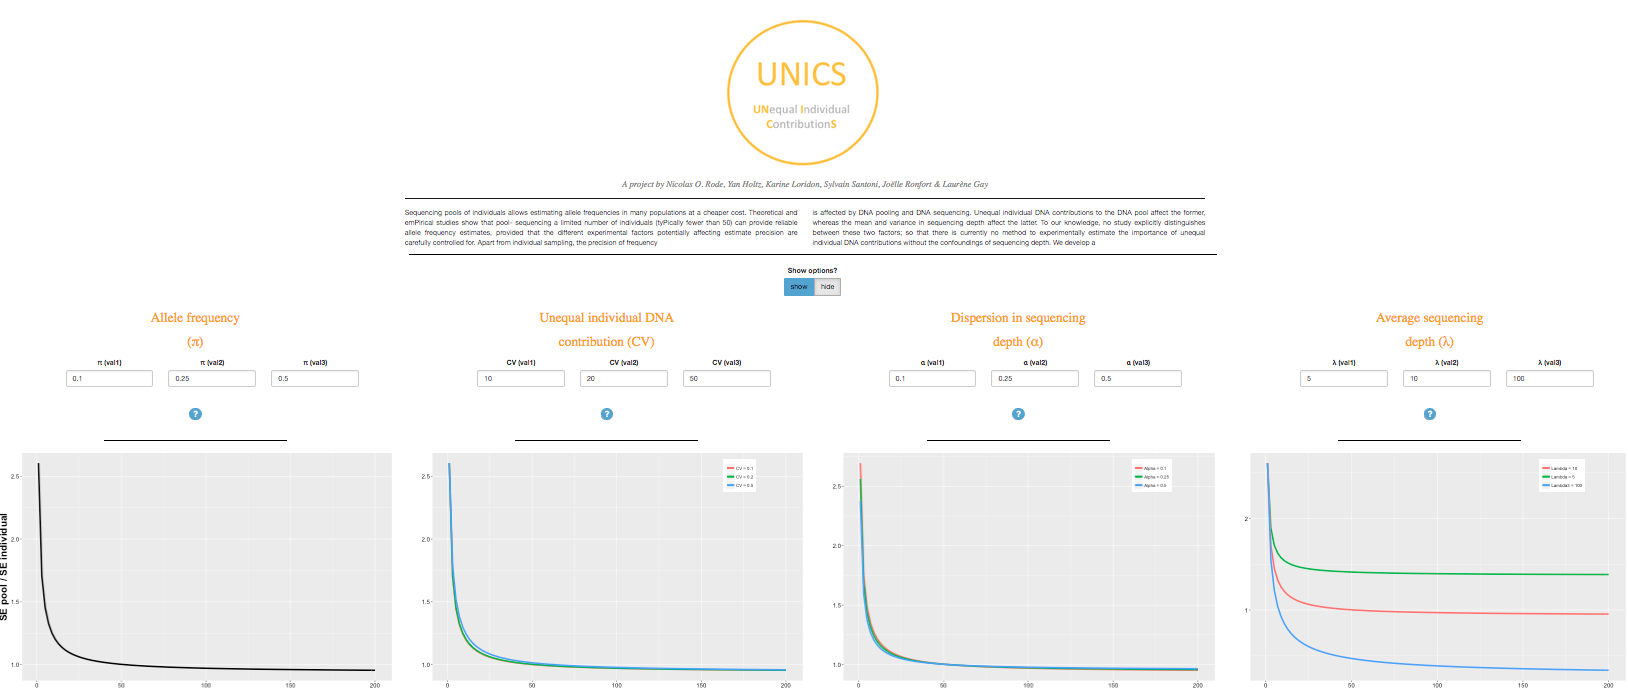
Aseda Science — a full data-exploration dashboard
built from the ground up, turning a complex dataset into
an interface anyone can navigate.
More examples in the portfolio
section below.
Let's talk
Got a dataset, a dashboard, or a Shiny app that deserves
better? Tell me about it — I'd love to help make it
shine.